📊 Data Tab
After creating a project, you'll be redirected to the Data tab. This is where you can view and analyze the dataset you uploaded. The page provides a preview of your data, as well as the responses generated by each agent based on that data.
🔍 Understanding the Data Table
The data table is the main feature on this page, and it is organized into the following sections:
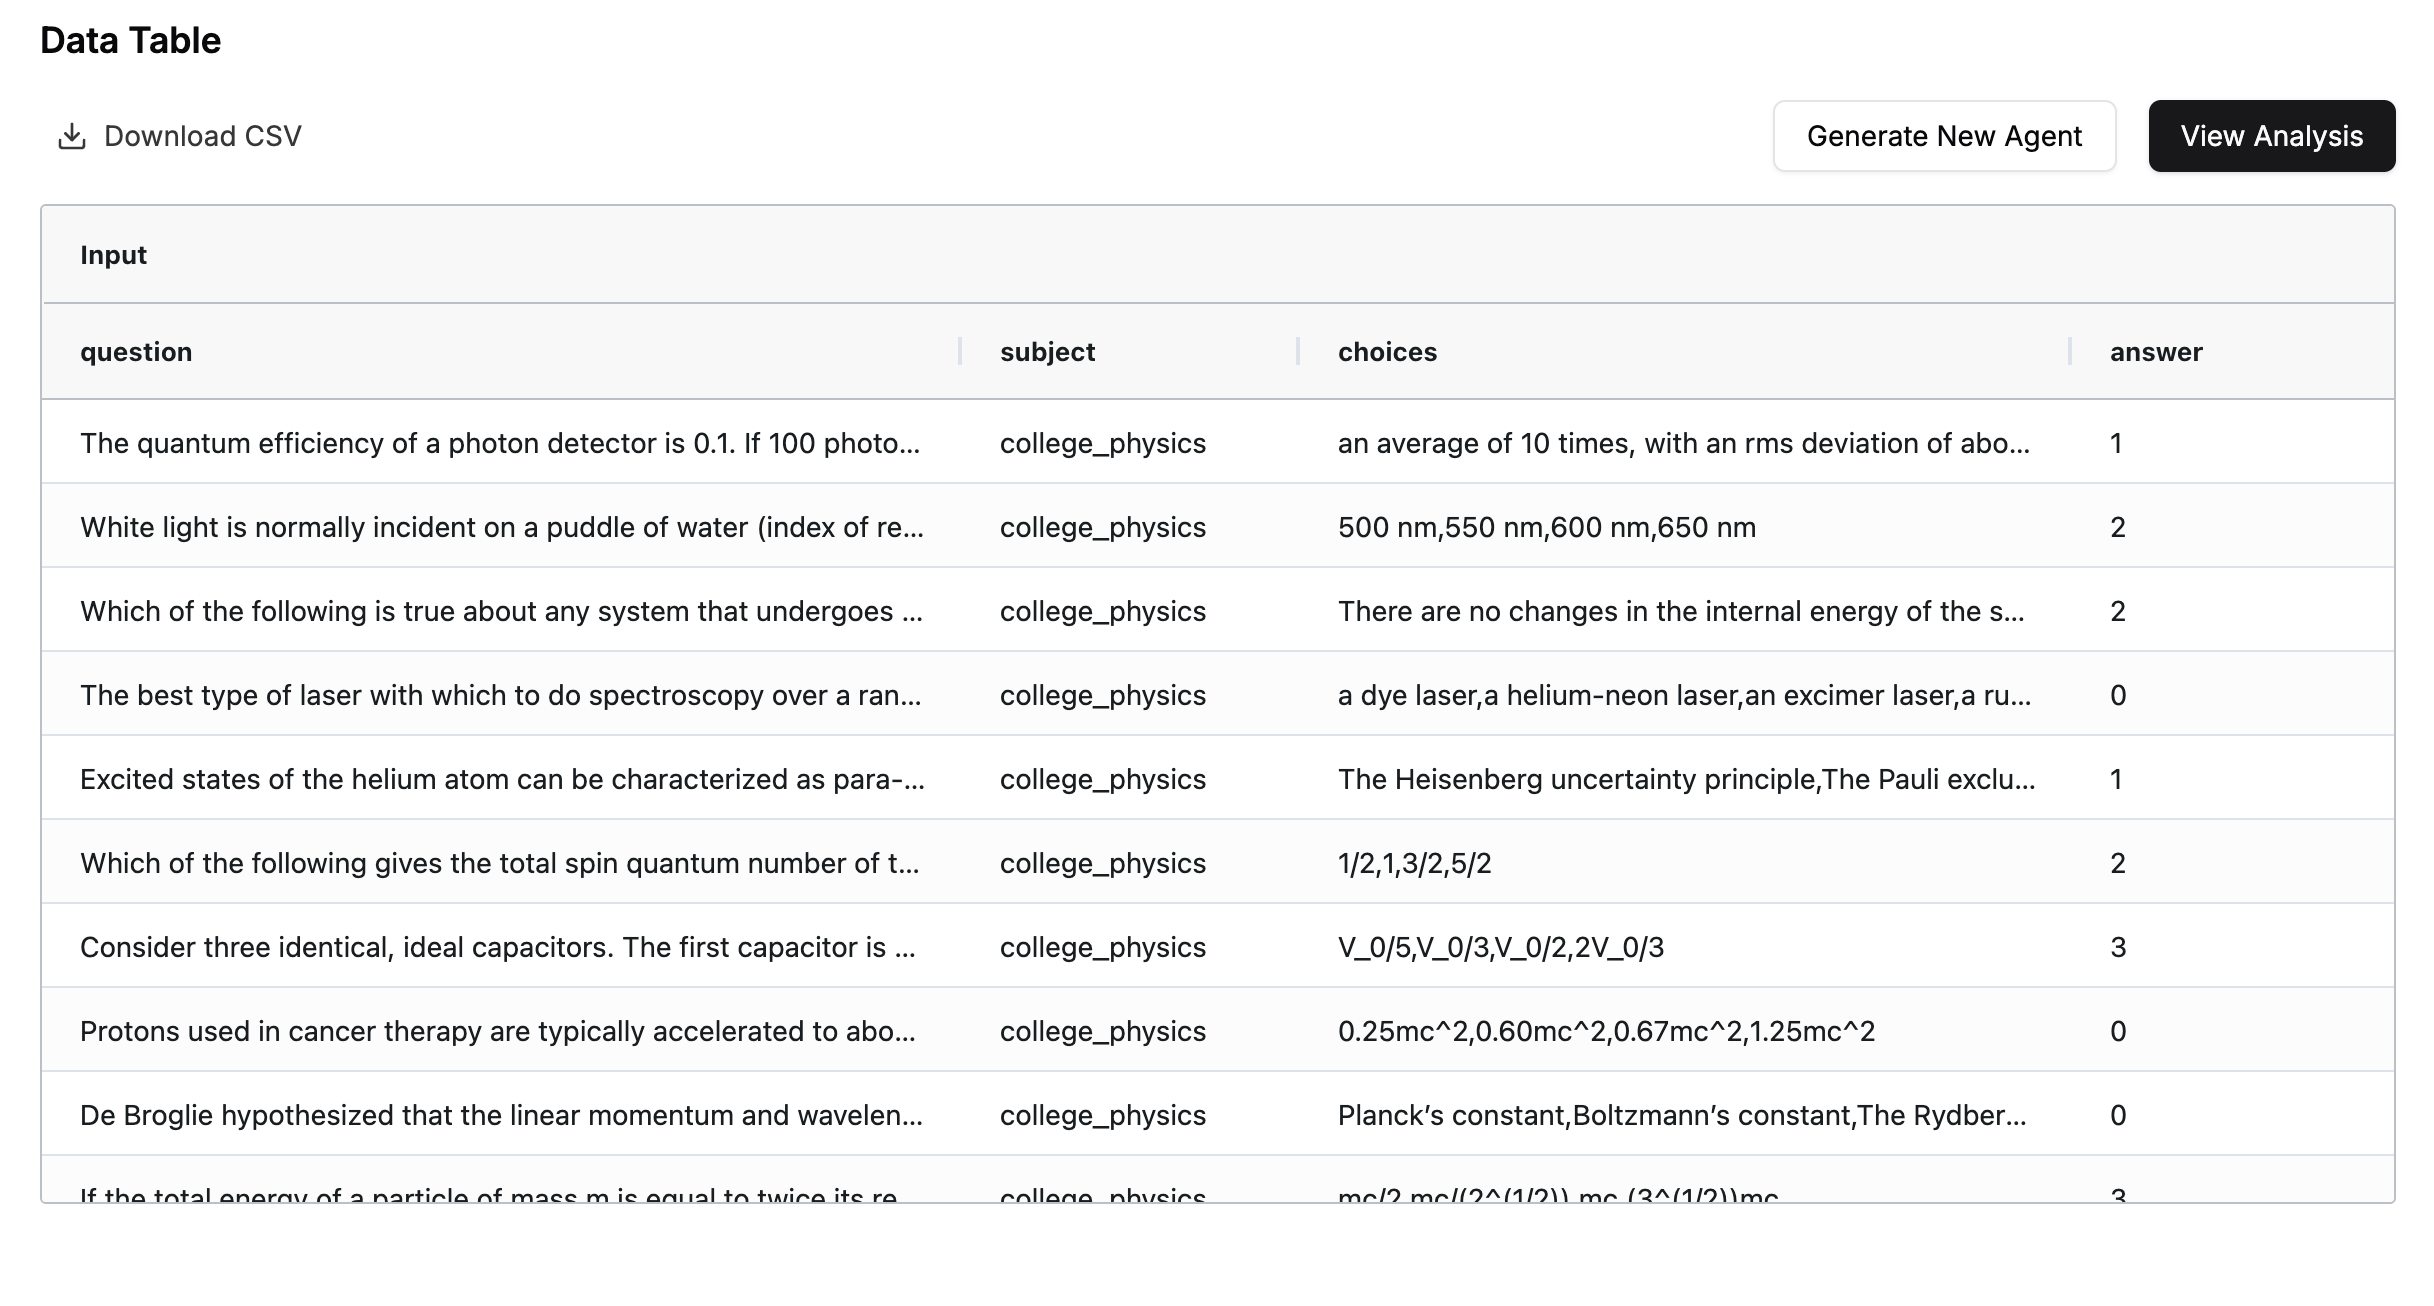
📥 Input Columns
- Contains the dataset you uploaded
- This dataset is used to benchmark the performance of the meta-agent.
📎 How the Table Works
- Initially, when you open the page, the input columns will be populated with the dataset you uploaded.
- This dataset is used to benchmark the performance of the meta-agent.
🔍 Viewing Run Details
- Right click on any row to view the option for detailed information about the agent run for that specific data point.
- Currently, the details view is coming soon! This will show additional information about the selected row.
💡 Next Step: To begin meta-agent generation process, let's head over to the Settings tab. There, you can configure a new agent to start processing the data.